Abstract
Differential recovery refers to the ways faunal assemblages are sampled from the archaeological record. Its effects can be pernicious when interpreting data from multiple assemblages. As such, the topic is a mainstay in contemporary zooarchaeological research; however, in the U.S. Southwest, differential recovery has received less attention. One reason could be the excellent archaeological preservation of faunal remains in the region. Researchers may be more inclined to assume representativeness without consideration of differences in recovery among faunas. Here, we explore the interaction between recovery and other taphonomic variables from multiple large faunal assemblages recovered from the central Mesa Verde Region of southwestern Colorado and the Northern Rio Grande region of north central New Mexico.We analyze faunas from five sites: Tsama Pueblo (LA 908), Ponsipa-akeri (LA 297), Shields Pueblo (5MT3807), Goodman Point Pueblo (5MT604), and the Haynie site (5MT1905). These sites represent varying degrees of sampling intensity and disturbance, spanning a continuum from low- to high-quality recovery. Our goal is to propose a suite of basic analyses to assist Southwestern archaeologists in making decisions about the inclusion of individual faunal assemblages in large datasets. A standard checklist can improve data quality and strengthen interpretation in this region of extreme cultural significance.
The Workflow
Below is a simplified workflow we used to evaluate differential recovery among five different archaeofaunal assemblages. Of course, this type of workflow is highly dependent on the context people are working in. But we suspect this workflow can be easily translated across the U.S. Southwest considering taxonomic composition is usually roughly similar. We suggest a workflow that starts off generally simple, explores basic quantitative units first, uses data visualization to analyze research questions (in what is known as Exploratory Data Analysis), incorporates the size of specimens, and then uses modeling (here we generally use this term to mean robust ways to subsample data) to facilitate archaeofaunal assemblage comparison.

Assemblage Info
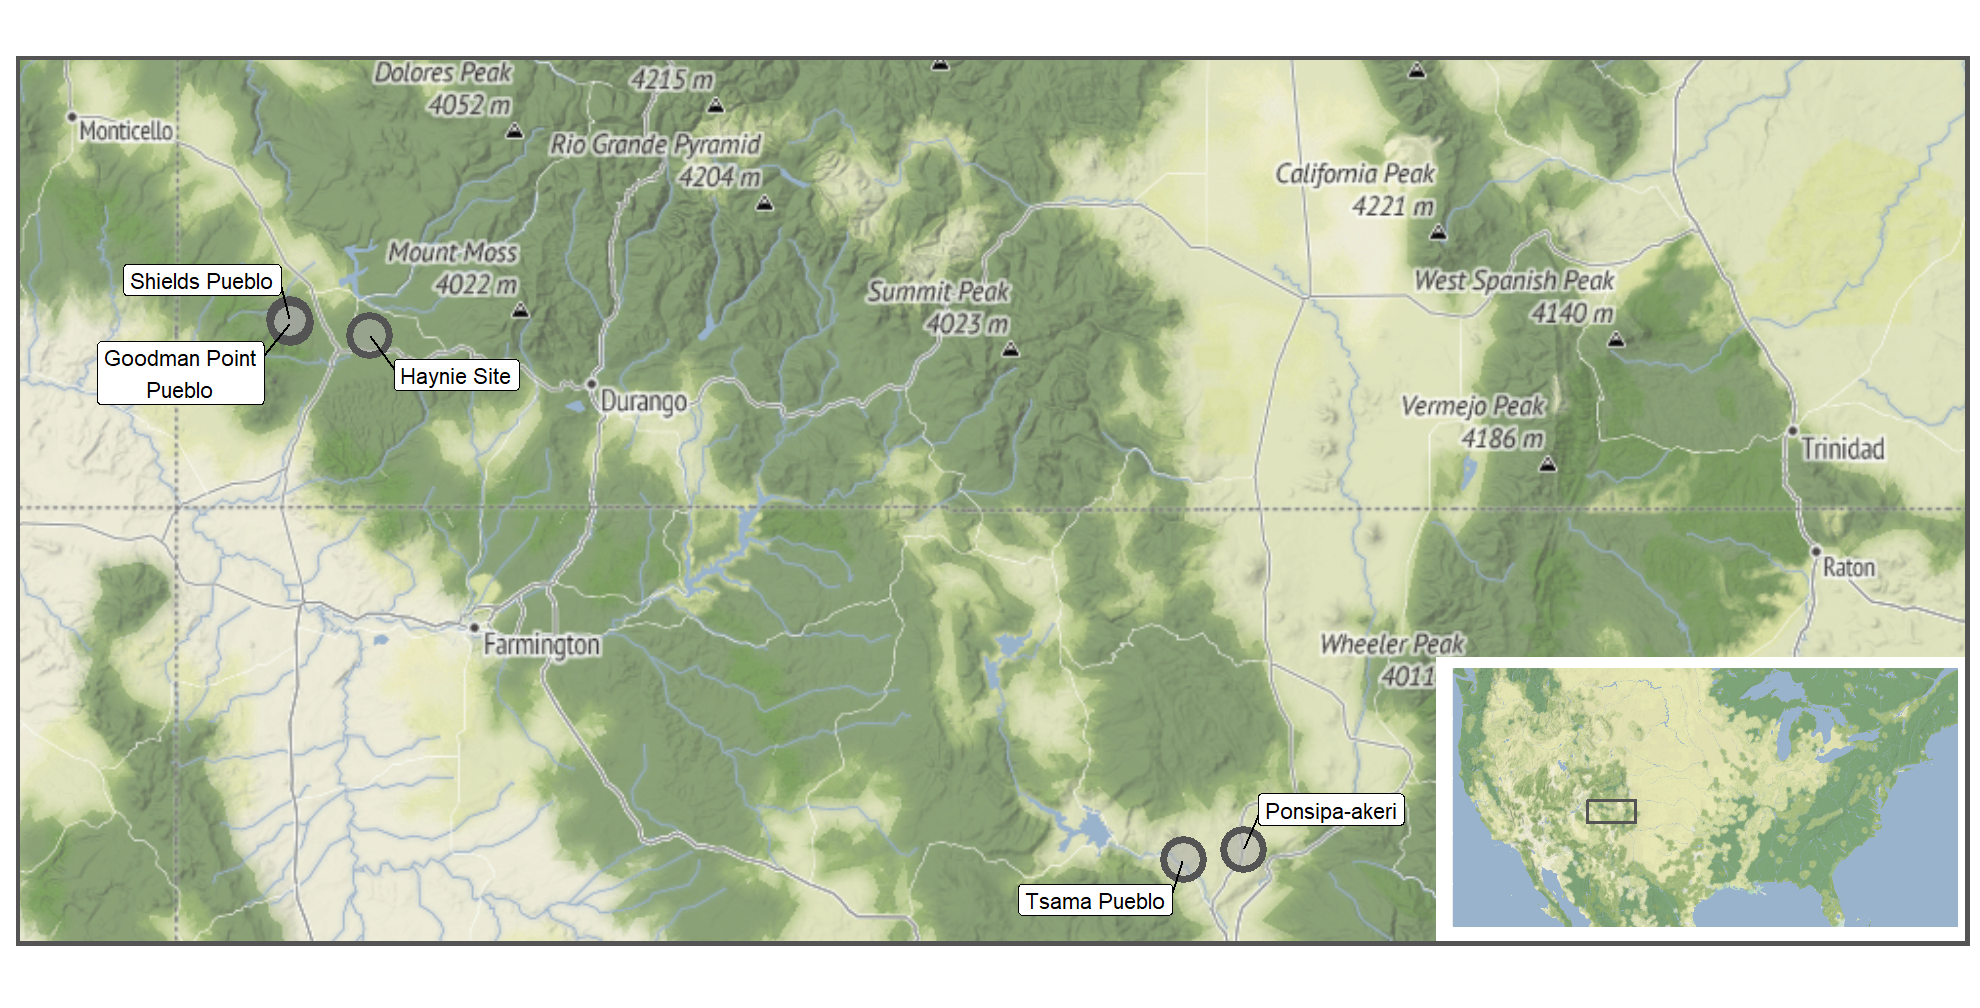
We have multiple archaeofaunal assemblages from two different regions of the northern U.S. Southwest: the central Mesa Verde region and the Northern Rio Grande region. The assemblages were recovered using different methodologies. Our question is: how do we test whether differential recovery prevents a meaningful comparison of these assemblages?
Where?
What?
Site Name |
Occupation (AD) |
Sampling Method |
Number of Specimens |
|---|---|---|---|
| Tsama Pueblo | 1300–1600 | Handpicked | 2981 |
| Ponsipa-akeri | 1300–1600 | Partially Handpicked | 6438 |
| Haynie Site | 750–1280 | 1/4-inch mesh | 7831 |
| Shields Pueblo | 500–1300 | 1/4-inch mesh | 38887 |
| Goodman Point Pueblo | 1260–1280 | 1/4-inch mesh | 14423 |
Exploratory Data Analysis
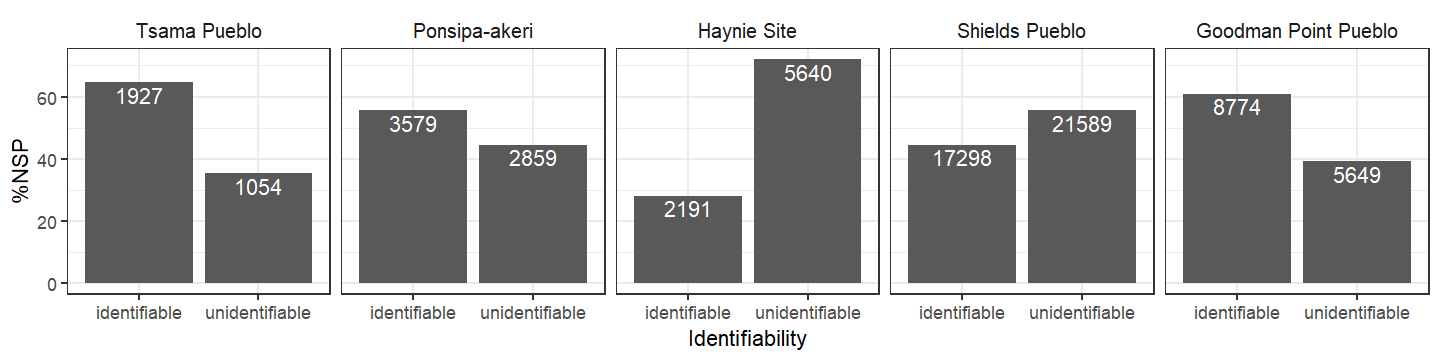
Identifiability and Number of Identified Specimens
A simple way to explore potential differential recovery issues is through identifiability since it is influenced by specimen size. With a handpicked assemblage like Tsama, people may have purposefully selected only identifiable bones, which, as a result, may have been larger. Tsama does have the largest percent difference between identifiable and unidentifiable specimens. Are there actually more identifiable and fewer unidentifiable specimens at Tsama, or does this pattern reflect handpicking?
The relative abundance (%NISP) of species across the sites also follows a pattern. Cottontails are the highest ranked taxon recovered across all sites. Turkey or jackrabbit are the second most common taxa, except at Tsama where it is deer. Additionally, there is a more even distribution of the top three taxa at Tsama, while at the other sites there seems to be a larger amount of cottontails related to the other lower ranked taxa (i.e., taxonomic distribution is less skewed at Tsama). Is this result the actual structure of the Tsama fauna or an artifact of handpicking?
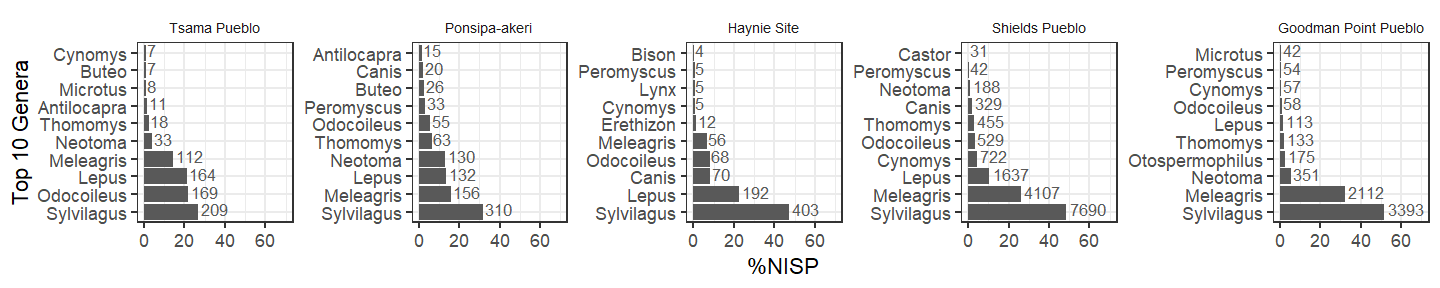
At a coarser taxonomic level (Order, including non-standard identification types such as “Medium Artiodactyl”), artiodactyls are the most abundant taxon at Tsama, but the overall shape of the distribution becomes more similar across all sites. Are artiodactyls simply more abundant at Tsama than at the other sites?

Skeletal Part Frequency of Recovery-Sensitive Taxa
Skeletal part selection of smaller mammals can also help determine whether field archaeologists preferentially collected only certain types of skeletal specimens from handpicked assemblages. In our dataset, skeletal elements are even across all sites, suggesting non-selective measures for skeletal parts.
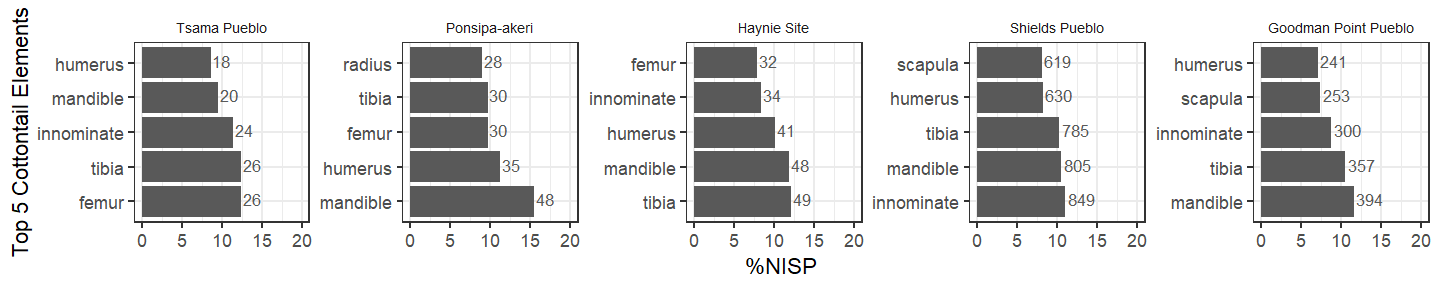
Rodent mandibles are the most common skeletal part across all sites. But, regarding differential recovery, there again is a rather even distribution of skeletal element types across rodents in the Northern Rio Grande region sites.

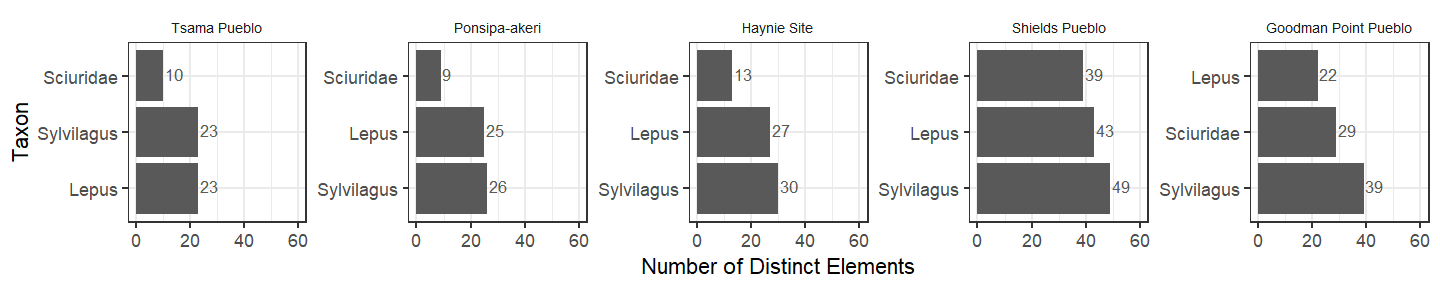
Because common smaller mammals may have a lower likelihood of collection at handpicked sites, we might anticipate a larger number of different elements at screened sites compared to the handpicked sites. Instead, we see a larger diversity across all taxa at Shields Pueblo, which we attribute to the massive sample size there. Aside from Shields, the number of distinct element types from jackrabbits and cottontails is similar across sites. Something interesting is happening with squirrels (family Sciuridae), though. Their element types are less diverse at the Northern Rio Grande sites, but more diverse in the central Mesa Verde region. One possible explanation for this pattern is less disturbance by intrusive prairie dogs at the Northern Rio Grande sites.
Size-Based Comparisons
While identification protocols are designed to focus on different data sources for different projects, we highly recommend measuring skeletal specimens with calipers to understand issues related to differential recovery. This is especially the case when one envisions integrating a new faunal dataset with other datasets in larger regional studies. The presence or absence of screening actively selects specimens based on their physical size.
General Trends in Identifiability
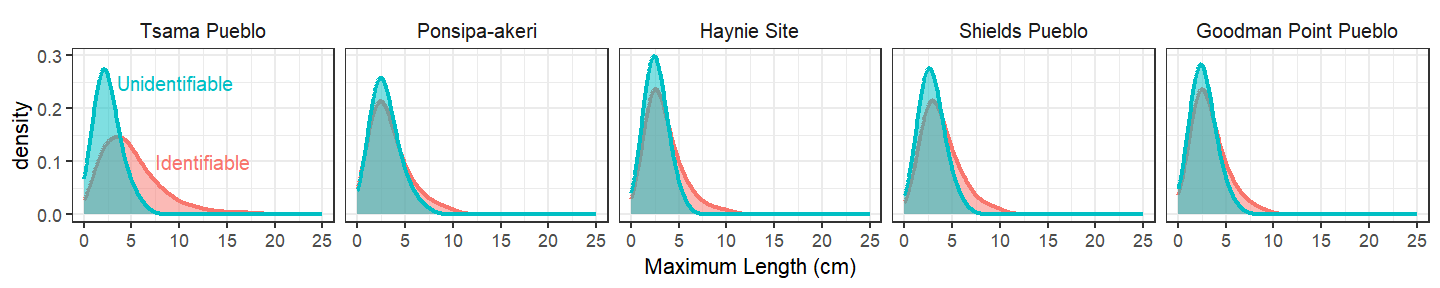
Comparing the size distribution of identifiable and unidentifiable specimens can help highlight potential issues with recovery. The unidentifiable specimen size distribution is remarkably similar across all the sites, and we see the identifiable and unidentifiable size distribution usually converges. However, identifiable specimens at Tsama tend to be larger, which could be an indicator that handpicking has unduly impacted this archaeofaunal assemblage. But how can we be sure?
Taxonomic Trends
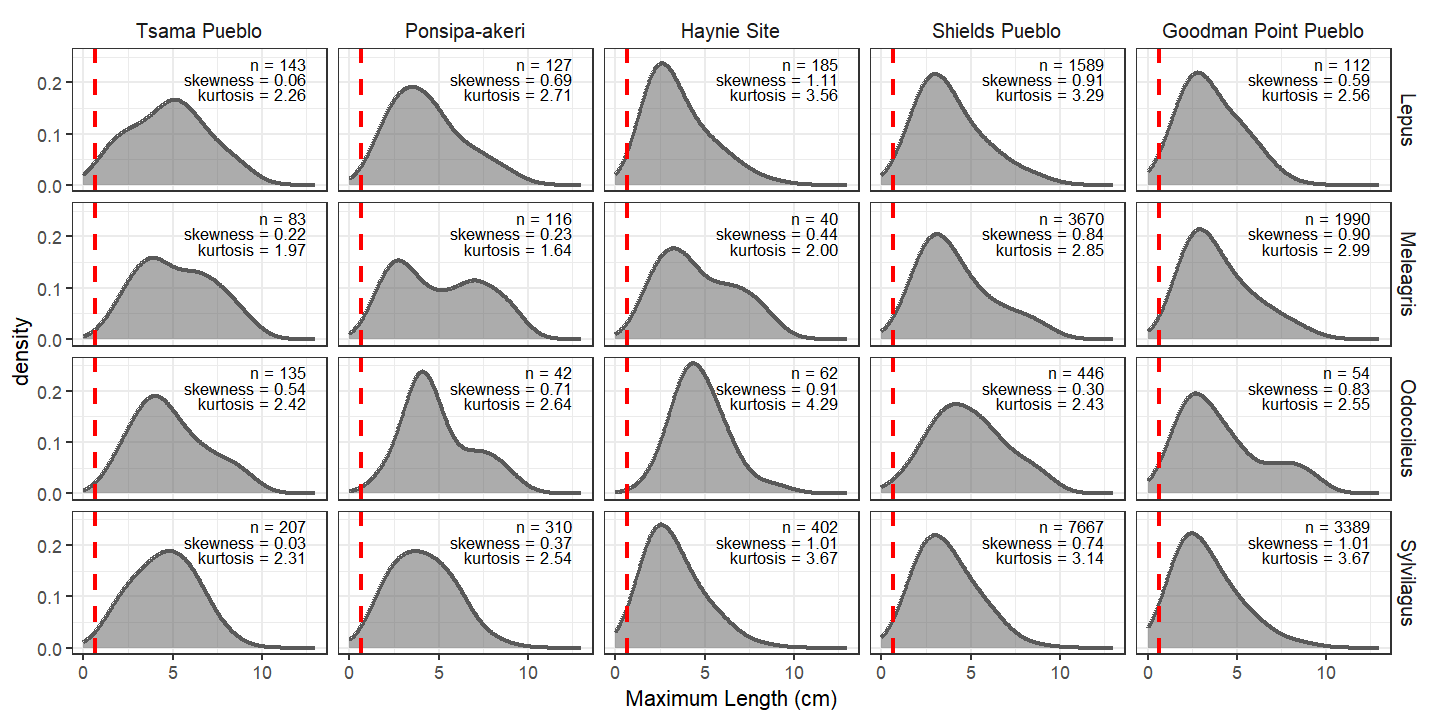
In circumstances where identifiable specimens tend to be larger than unidentifiable specimens, we suggest isolating common taxonomic groups in the study region. Here, we see the peak of distributions is rather similar across sites and taxa, and these peaks always appear beyond the 1/4” demarcation (the vertical red line). The shape of the distribution at Tsama is what differs. Calculating skewness and kurtotsis helps quantify this. The size distributions of specimens at Tsama are consistently less skewed and less peaky, meaning specimens are consistently slightly bigger but specific taxa are not driving this pattern. All the identifiable specimens tend to be bigger at Tsama (we grouped these data in many different ways to be sure). Is this indicative of the true structure of the Tsama fauna? We believe this is the case.
The below figure was not included in the poster, but it is important to note Tsama does not include a conspicuously high number of whole elements. So, it seems excavators were not preferentially selecting whole elements, which could lead to the above size distribution patterns.

Recovery-Sensitive Taxonomic Trends
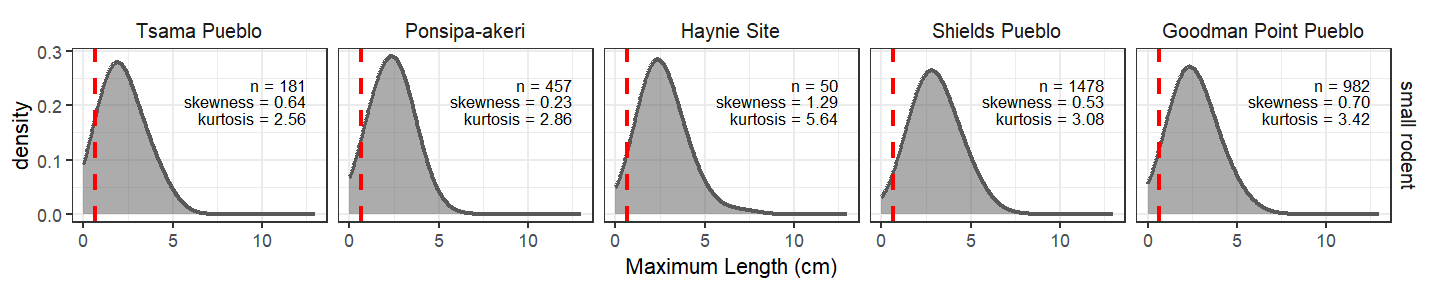
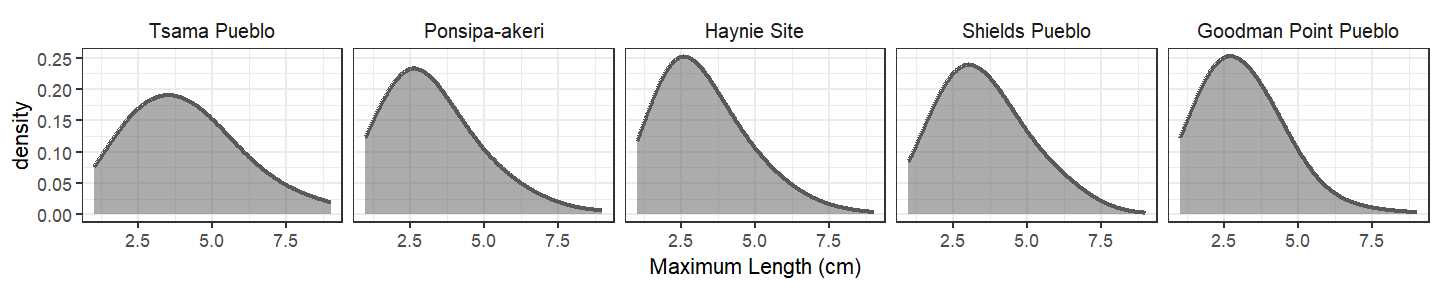
One of the reasons we believe the underlying structure of the Tsama fauna simply includes larger specimens from larger taxa is illustrated in the figure below. We isolated taxa from the smallest body size categories from the smallest taxonomic group in our dataset (small rodents). We consider this one of the most recovery-sensitive taxonomic groups we can analyze across all the sites. What we see is their size distribution is remarkably similar across sites/recovery methods.
Modeling
Another way to further explore differential recovery is through modeling. We suggest starting off with simpler analyses first (as noted above), because they will help inform more complex models, should you choose to use such techniques.
Taxonomic Diversity and Rarefaction
Assessing taxonomic diversity is a must when it comes to differential recovery. More intensive recovery techniques may capture more specimens from diverse taxa.
Below we randomly shuffled all identified specimens at each site 500 times and calculated the mean cumulative sum as one moves through the sample. The purpose of this exercise was to evaluate how quickly diversity “stacks up” at each site. More diverse sites will accumulate diversity faster as sample size increases. However, it is very hard to compare diversity at these sites because of the difference in sample size.

This problem is solved through rarefaction. Below, we do the same thing as above but randomly select 1750 specimens from each assemblage 500 times. Thus, we rarefy each sample to the lowest sample size in our collection (i.e., from Tsama). This makes it easier to compare the accumulation of diversity at each site because we hold sample size constant. What we see, below, is the opposite of the pattern we would anticipate if there was a large degree of recovery bias. Tsama is the second most diverse assemblage in our sample followed by Ponsipa-akeri. Some of the most intensively recovered faunas are simply less diverse (Shields and Goodman Point).

Handpicking Across Sites
While evaluating taxonomic diversity through modeling is somewhat well-worn territory in zooarchaeology, we introduce a different technique below. If we were to subsample each of our archaeofaunal assemblages based on the general specimen size distribution from Tsama Pueblo would clear indicators of size-based bias become apparent in the other assemblages? The idea here is to create an artificial Tsama-like specimen distribution from the other assemblages and evaluate their properties. For instance, would the subsample from Goodman Point or Shields force artiodactyls to become higher ranked? Would such a sample include a conspicuous number of distinct skeletal element types?
To create the below subsamples, we took 500 random samples from each assemblage but weighted the sampling by the density distribution for specimen length at Tsama Pueblo (see Section 5.1). This is as close as one can make all these assemblages look like Tsama in terms of size distribution.
The below graph shows the abundance of the top 10 genera from this subsample. Taxonomic abundances do not significantly shift compared to their unmodeled counterparts, which suggests the size distribution of Tsama Pueblo doesn’t really impact taxonomic abundance patterns at the other sites. Unsurprisingly, cottontails remain the most abundant genus and jackrabbit, turkey, and deer are differently ranked throughout (as the unmodeled assemblages were).

Does the number of distinct element types differ from recovery-sensitive (small-bodied) taxa within these modeled subsamples? Not really. There are slightly fewer jackrabbit elements from Ponsipa-akeri compared to its unmodeled sample, but it isn’t very different, say, from the jackrabbit elements from the modeled Shields Pueblo assemblage. The lower diversity of sciurid elements remains similar in the Northern Rio Grande sites.

From the above exercise, it would not seem reasonable to assert the specimen size patterns at Tsama are strong enough to significantly influence basic zooarchaeological measures. Thus, perhaps factors related to differential recovery are not strong enough to impact a general comparison of these faunal assemblages. It could be these archaeofaunal assemblages are indeed generally reliable indicators of past environmental conditions and human behavior.
Acknowledgements
We acknowledge the Pueblo, Ute, Paiute, Diné, and Jicarilla Apache peoples on whose traditional homelands these sites rest. We also thank all the researchers, staff, and interns associated with data collection from each of these projects at Crow Canyon Archaeological Center (and numerous other institutions). In particular, we thank Tiffany Rawlings, Jonathan Driver, Amy Hoffman, Eric Gilmore, and Ahna Feldstein for their work analyzing fauna. The following institutions have helped preserve these sites: The Archaeological Conservancy, National Park Service, the Bureau of Land Management, and Colorado Mountain College. Funding was provided by the National Science Foundation, National Endowment for the Humanities, History Colorado State Historical Fund, and the Earthwatch Institute.